DATA ANALYST PORTFOLIO
TANMOY
GHATAK
Turning complex data
into actionable insights

Turning complex data
into actionable insights
Aspiring Data Analyst transitioning from a successful career in game development, bringing strong technical foundations in programming, problem-solving, and systems thinking. Proficient in Python, SQL, Power BI, and Microsoft Excel, with hands-on experience in machine learning techniques including supervised and unsupervised learning.
With over 3 years of experience as a Senior Game Developer at MedVR Education, I built immersive VR/AR applications, designed complex behavior systems, and created data-driven workflows — skills that translate directly into analytical thinking and data modeling.
Completed multiple courses covering Python for Data Analysis, SQL for Data Science, Machine Learning Fundamentals, and Data Visualization with Power BI.
Developed immersive VR/AR educational applications for medical training, demonstrating strong technical problem-solving and systems design skills applicable to data structures and algorithms.
Designed gameplay mechanics and NPC behavior systems applying logical thinking and pattern recognition — skills directly transferable to data modeling. Created UI widgets and interactive components emphasizing user experience principles crucial for effective dashboards.
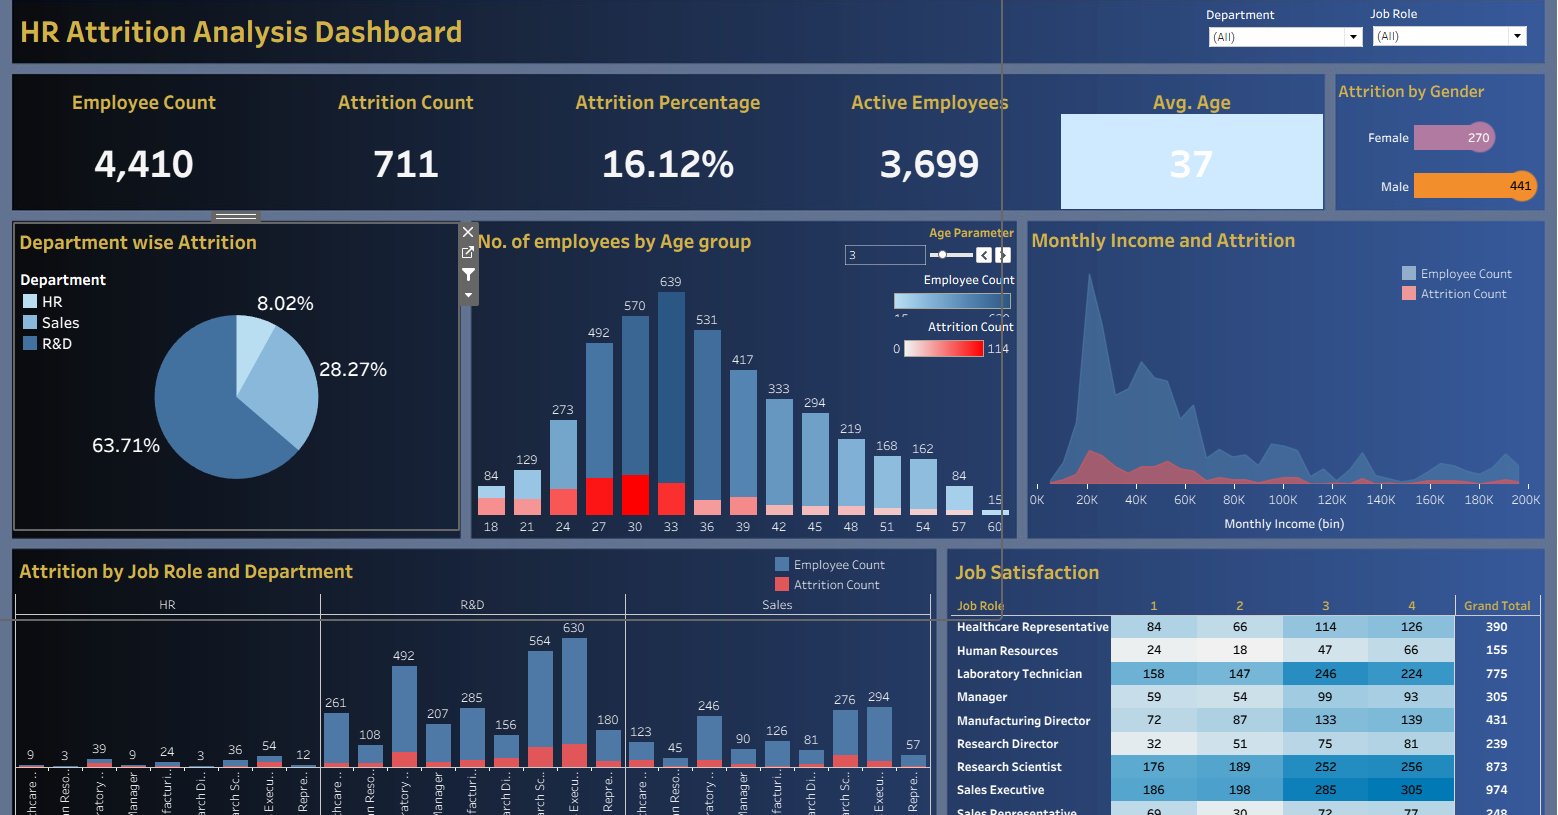
A comprehensive Tableau HR Analytics Dashboard examining employee turnover patterns across 4,410 employees to understand who is leaving, why, and what can be done to improve retention. Identified an overall attrition rate of 16.12% with critical findings across departments, gender, age groups, and salary bands.
Key findings revealed R&D department attrition at 28.27% — nearly 1 in 3 employees leaving annually — and a significant gender disparity where female attrition (36.5%) was 2.2× higher than male (16.5%), enabling targeted retention strategies with projected savings of $2M–$5M annually.
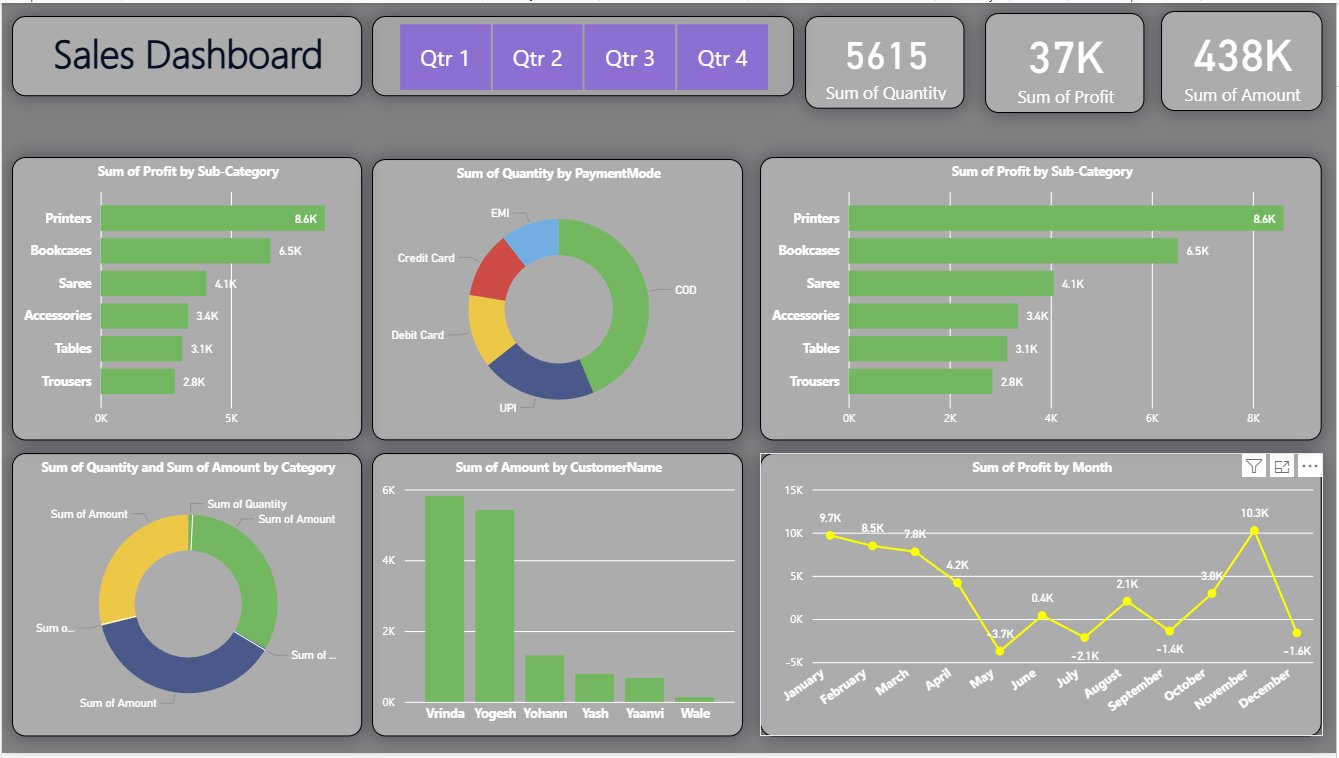
A comprehensive Power BI e-commerce dashboard analysing sales, profit, and customer behaviour across India for the full year 2018. Built an interactive multi-page report with DAX formulas and Power Query to model relationships between two datasets — Orders and Order Details — delivering dynamic quarterly filtering and drill-down capabilities.
Key findings: Printers and Bookcases drove the highest profit at ₹8.6K and ₹6.5K respectively. COD dominated payment modes at 44%, while November was the peak profit month at ₹10.3K. Identified seasonal dips (May–August) enabling targeted promotional planning.
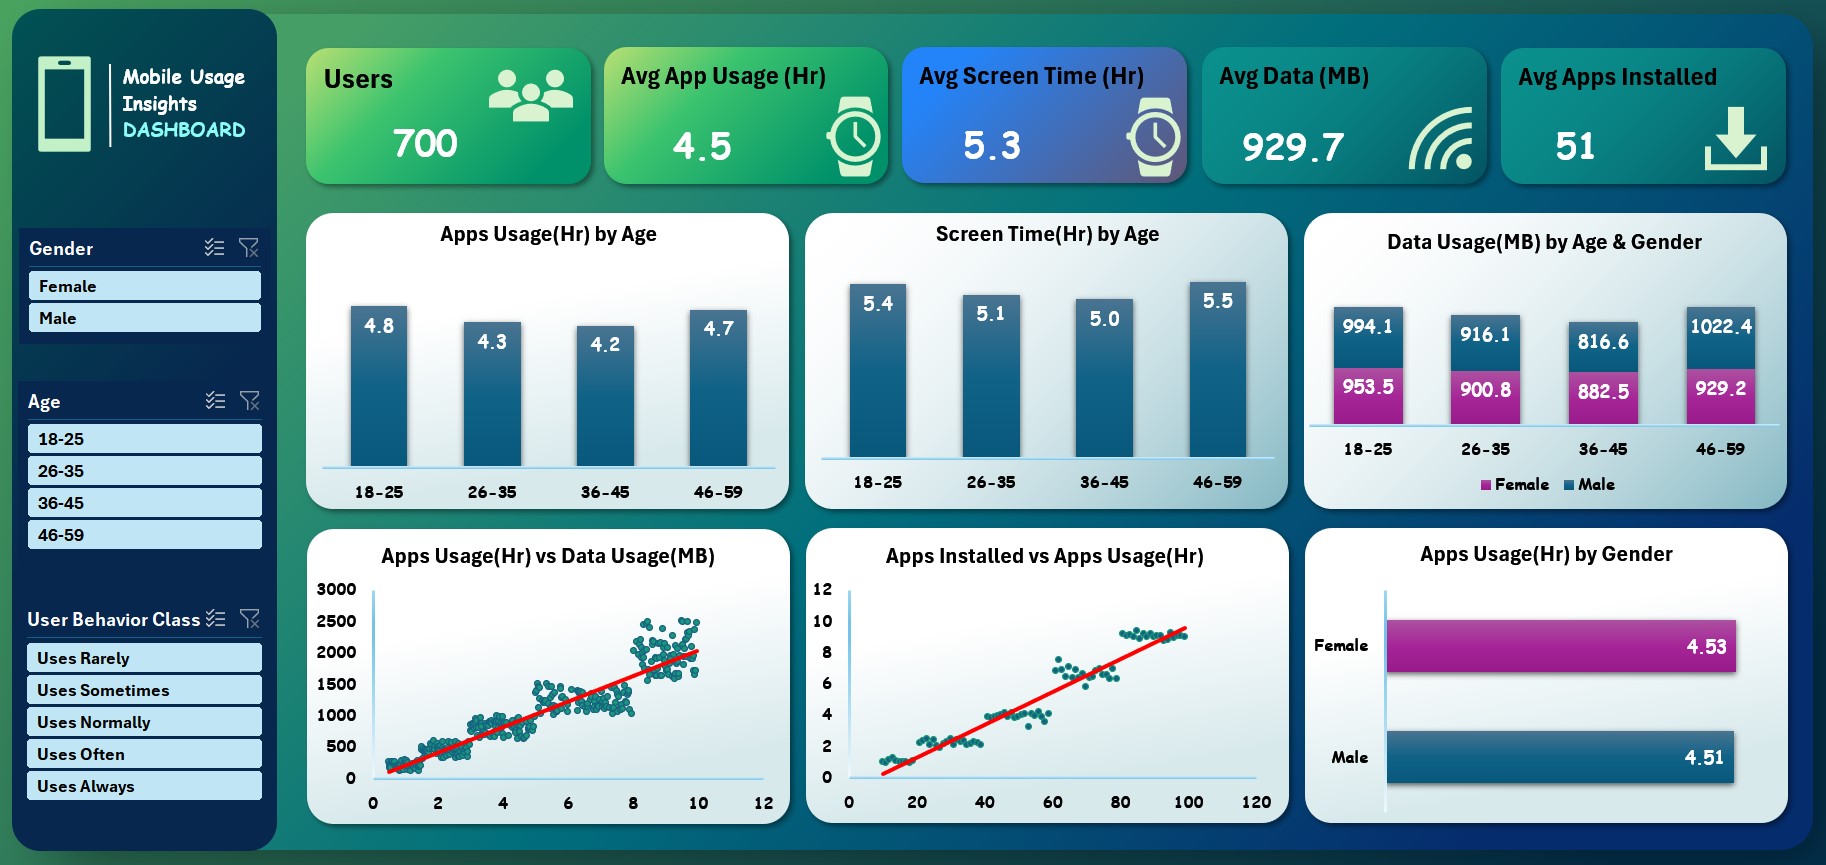
A comprehensive Microsoft Excel dashboard analysing mobile app usage behaviour across 700 users segmented by age group, gender, and behaviour class. Built interactive visualisations tracking app usage, screen time, data consumption, and app install patterns — with scatter plots confirming strong positive correlations between apps installed and usage hours.
Key findings: The 18–25 age group leads app usage at 4.8h/day, while 46–59 year-olds consume the most data at 1,022 MB. Gender usage is near-equal (Female 4.53h vs Male 4.51h), and average screen time of 5.3 hours/day signals high engagement across all segments.